👋 Hi, it’s Kyle Poyar and welcome to Growth Unhinged, my weekly newsletter exploring the hidden playbooks behind the fastest-growing startups. Subscribe to join 52,825 readers who get Growth Unhinged delivered to their inbox every Wednesday morning.
I started the OpenView SaaS benchmarks report back in 2017 because there was a lack of useful metrics data for private startups.
Many folks worried the report might be over. Not so fast… I’m excited to share that I am teaming up with my friends at High Alpha and Paddle to bring back the 8th annual report! With so much changing in SaaS (and AI), it’ll finally provide objective data on what’s happening.
These benchmarks always yield surprising insights about growth, efficiency, tech stacks, go-to-market strategy, and much more. Keep reading for ten of my favorite growth charts from the last year (in no particular order).
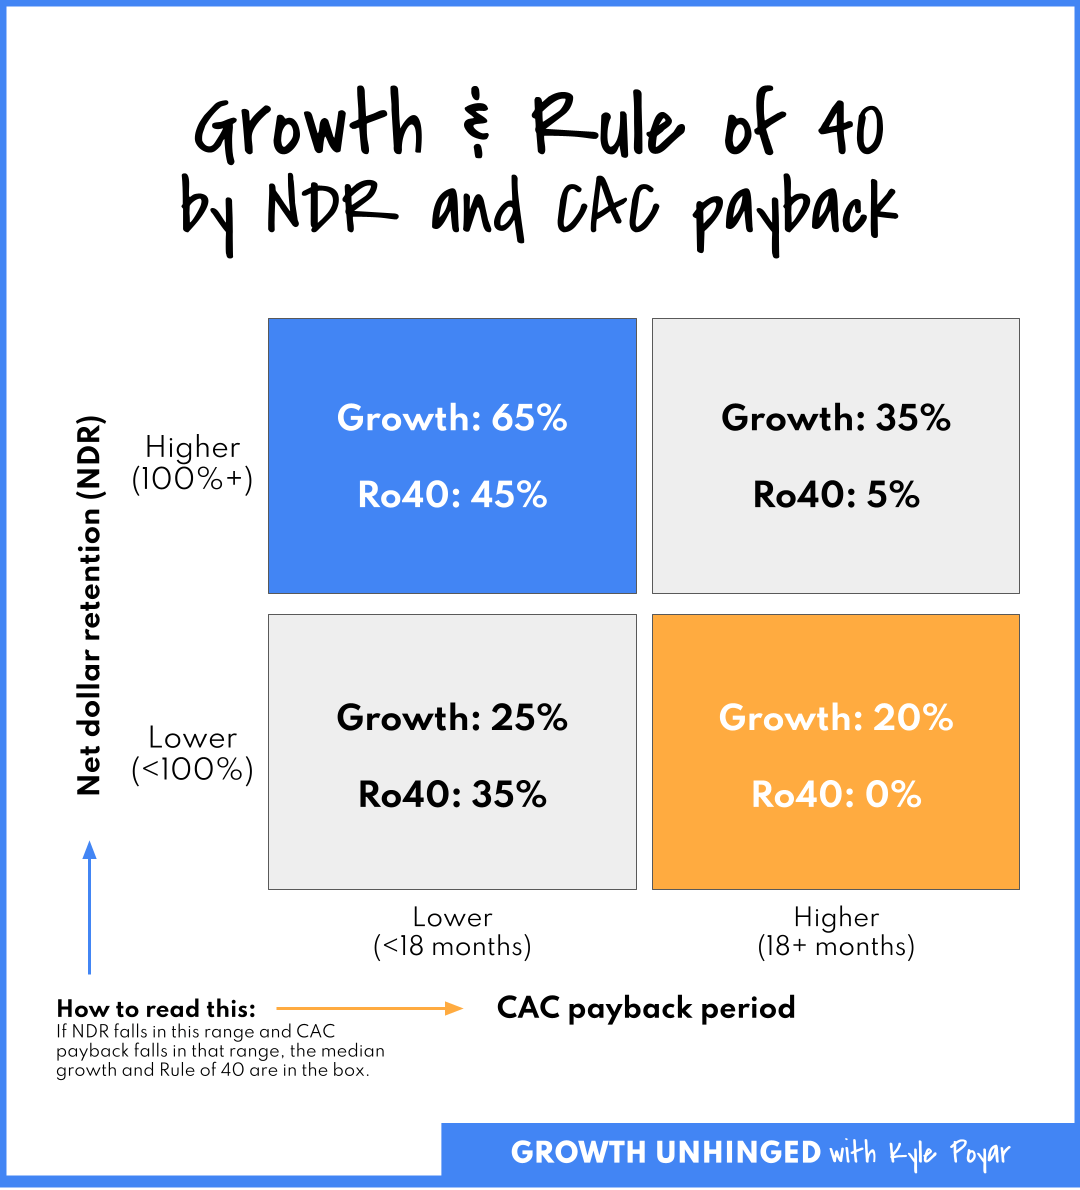
1. THE BEST PREDICTOR OF EFFICIENT GROWTH? LOOK AT CAC PAYBACK PERIOD PLUS NET DOLLAR RETENTION.
Low CAC payback (<18 months) and high NDR (100%+) is your ticket. Read more: your guide to CAC payback period.
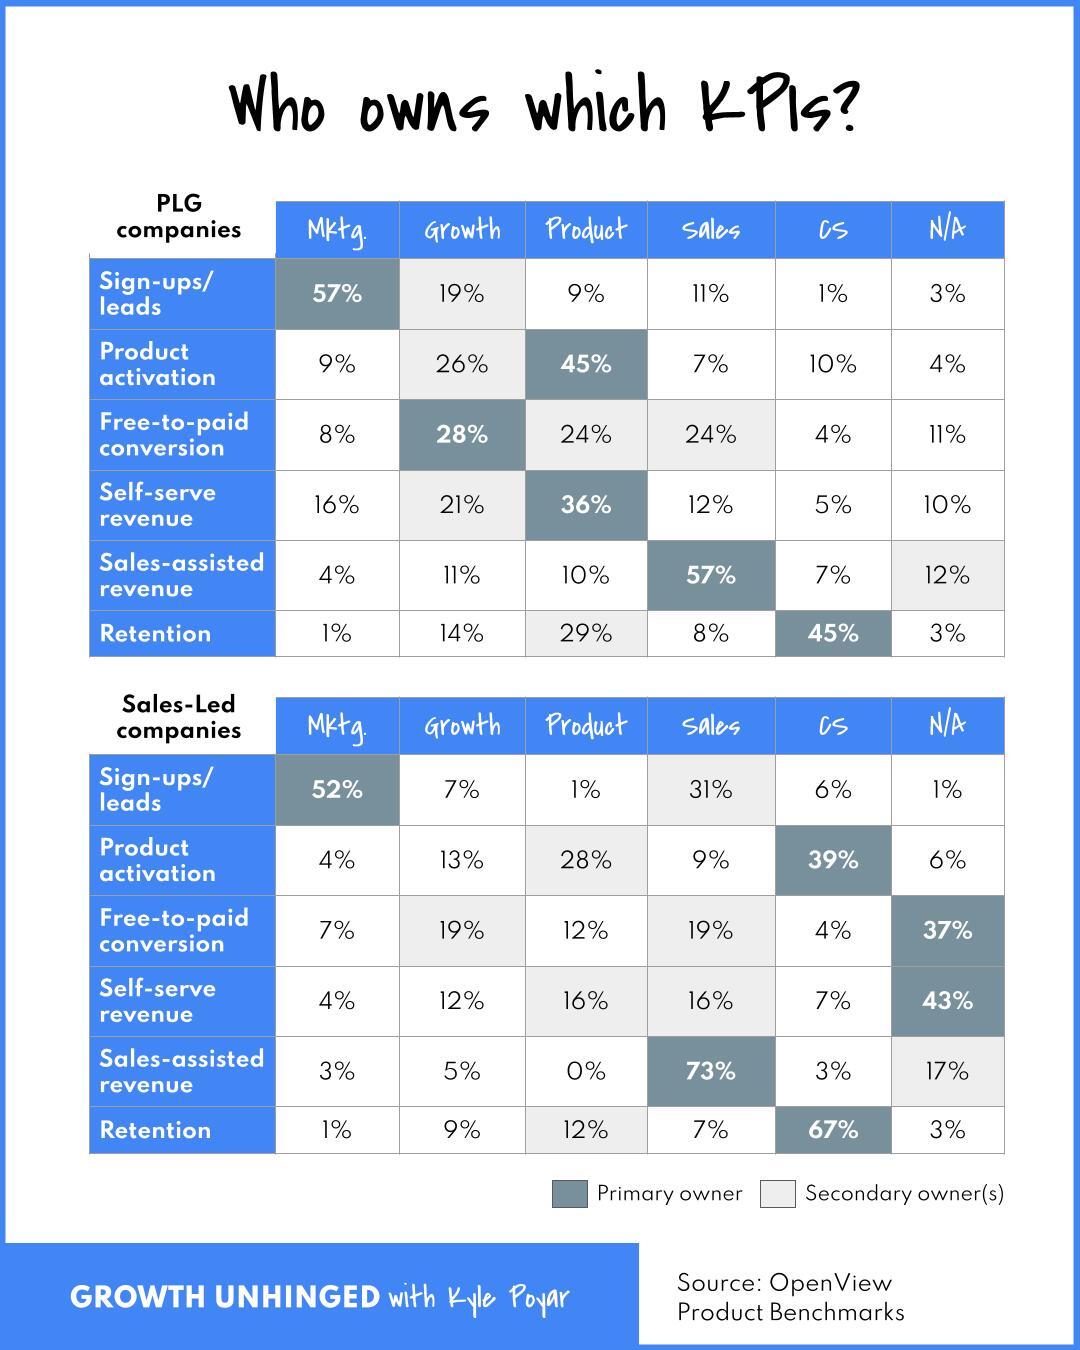
2. WHO OWNS “GROWTH”? IT DEPENDS…
It’s fascinating to see the differences between companies with a product-led growth (PLG) motion compared to those who don’t have one.
The TL;DR: especially in a PLG environment, there is no single revenue owner!
3. YOU DON’T NEED TO BE A CFO TO CALCULATE THE HOT NEW SAAS METRIC: ARR PER EMPLOYEE.
SaaS seems to love complicated metrics. I’d be lying if I said I didn’t love a few of them, too.
An increasingly important metric is shockingly simple: annual recurring revenue (ARR) per full-time employee (FTE). It’s a metric you can’t hide from. There’s no complicated math or financial engineering to do. You don’t need to be a CFO to calculate it.
And the bar is getting higher. While we’re not quite in the one-person unicorn utopia envisioned by Sam Altman, SaaS companies really are doing more with less.
4. HOW BIG IS A NORMAL TEAM FOR A COMPANY MY SIZE? HERE’S WHAT THE DATA SHOWS.
5. FREEMIUM OR FREE TRIAL? OR NEITHER…
The FREEMIUM funnel with 1,000 website visitors:
Traffic: 460 come from organic sources, 180 from paid marketing
Sign-up: 90 sign-up for the free plan, 910 leave
Conversion: 4 convert to a paid plan, 86 stay free or churn
The FREE TRIAL funnel with 1,000 website visitors:
Traffic: 440 come from organic sources, 250 from paid marketing
Sign-up: 50 sign-up for the free plan, 950 leave
Conversion: 5 convert to a paid plan, 45 stay free or churn
The REVERSE TRIAL funnel with 1,000 website visitors:
Traffic: 460 come from organic sources, 180 from paid marketing
Sign-up: 90 sign-up for the free plan, 910 leave
Conversion: 10 convert to a paid plan, 80 stay free or churn
Product funnel data is rarely clear-cut. In this case, it's pretty clear. Reverse trials seem to offer the best balance of acquisition and monetization.
6. THE TECH YOU NEED TO TURN YOUR PRODUCT INTO A GROWTH ENGINE.
The number of tools to help you adopt product-led growth (PLG) has exploded in only the last couple of years. What do you need today vs. what can you save for later? Here are three categories to flag.
Product analytics: Think of this as the CRM for your what happens in your product. 66% of folks use a 3rd party tool. It’s used by both PLG-native companies and those who aren't focusing on PLG.
Product onboarding: Think of this as a low-code/no-code way to help users adopt more of your product on their own. 35% of folks use a 3rd party tool. This is the only category that's more widely adopted among folks who aren't focusing on PLG.
Interactive demos: Your product can be a selling tool even if users can't self-serve. Interactive product demos are all the rage as we look for ways to blend PLG and sales. 14% of folks use a 3rd party tool despite this being a new category.
7. THE UNFORTUNATE REALITY IS THAT THERE’S USUALLY A TRADE-OFF BETWEEN GROWTH AND PROFITABILITY.
It's extremely rare to find SaaS companies that blend fast growth with profitability. Only one-in-ten fast growing companies (>50% year-on-year) were break-even or profitable.
There's a big shift once growth rates start to fall below 50% year-on-year. Roughly one-in-three slower growth companies were break-even or profitable. This number jumps to one-in-two among businesses with less than 20% YoY growth.
The takeaway: when growth slows below 50% year-on-year, expect to craft a path toward breakeven or profitability.
8. AS YOU REACH SCALE, EXPECT *HALF* OF YOUR REVENUE GROWTH TO COME FROM EXISTING CUSTOMERS.
If you knew that half of your future growth would come from existing customers, how would that change your strategy?
9. PRICING AND PACKAGING BECOME A HUGE LEVER AS YOU SCALE.
Average annual contract value (ACV) jumps by more than 100% during the journey from $1M to $100M+ in ARR. These ACV increases come in the form of price increases, product expansion, selling new packages or add-ons, and charging based on a pricing metric that naturally scales as adoption grows. All require understanding what customers are willing to pay for and how much they’re willing to spend.
10. THE EXCITEMENT OVER USAGE-BASED PRICING COOLS OFF.
Usage-based pricing (UBP) had been on the rise since at least 2018. Adoption appeared to be on pace to double from 27% in 2018 to approaching half of SaaS companies in 2022.
Enthusiasm has now cooled. UBP adoption is down slightly year-on-year from 46% to 41%. Meanwhile, 17% of companies are actively testing usage-based pricing, roughly in line with last year. Will GenAI revive it?
What else you should know
📚 To read. ICONIQ’s State of GTM report based on a survey of executives at 150 top B2B SaaS companies. Key finding: companies are diversifying their GTM motions (perhaps they need to rethink their GTM metrics, too?). Thanks for the tip,
!🎙️ To meet. I’m (finally) making it back to SF after two years away. Come say 👋 at Pear VC’s Zero to $1M GTM Summit on September 5.
📺 To watch. Ren Faire on Max. It’s like Succession, but at the Texas Renaissance Festival (and mostly real?).
Exceptionally useful, thank you!
Another one for my morning coffee